 Debugger
| Deskbar: | ||
| Location: | /boot/system/apps/Debugger | |
| Settings: | ~/config/settings/Debugger settings ~/config/settings/Debugger/ |
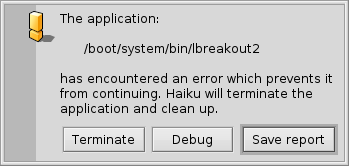
The Debugger is an application the common user hasn't much use for. It's targeted at developers to investigate bugs in programs. Sometimes those bugs result in crashes and that is when even end users come into contact with the Debugger. When a program crashes, you're confronted with this alert :

It offers four options to react to the crash:
will clean up after the crashed app but otherwise does nothing further.
will start the Debugger for further investigation.
creates a debug report which is saved as a text file on the Desktop and can be emailed to the developer of the crashed app or attached to a ticket at its bugtracker, if available.
The debug report contains information on your hardware (type of CPU and used memory etc.), the exact version of Haiku and all available information on the state of the system that could be relevant to the crash.creates a possibly huge dump of the system's state. Better attach a regular debug report first when submitting a bug report and only provide a core file on request.
The default action when a crash happens can be configured with a text file ~/config/settings/system/debug_server/settings.
The file takes on a driver_settings style format as follows:
default_action user

executable_actions {
	app1 log
	/path/app2* debug
}
Valid values for a default_action are:
| user | Prompt the user for action. | |
| kill | Silently terminate the crashing team. | |
| debug | Attach the debugger to the crashing team. | |
| log / report | Save a crash report and terminate the team. | |
| core | Save a (possibly very large) core file and terminate the team. |
If no default_action is specified, "user" is assumed.
The executable_actions subsection contains individual overrides of the default. These take the form above, where the individual lines can be only a team name, or a path, with wildcards.
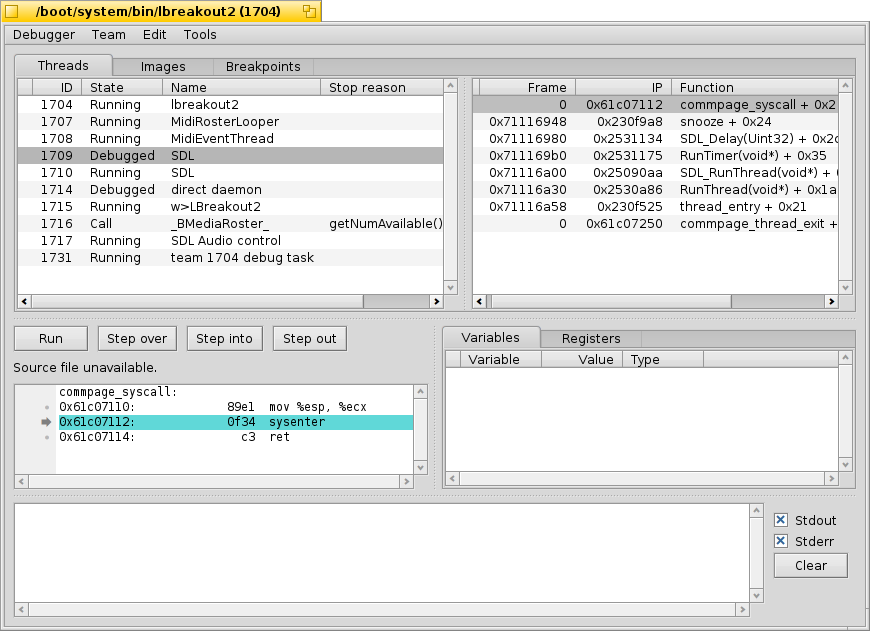
Describing the usage of the actual Debugger is out of scope for this guide that is addressing the needs of the common user of Haiku. For completeness sake, here's the window that'll come up if you choose the option in the above alert:

As you'll quickly see when you start poking around a bit, the Debugger is one of the most complex and sophisticated applications for Haiku. If you're a developer and are used to graphical debuggers on other platforms, many features will be familiar to you.
Below are a few links that may shed some light on the intricacies of Haiku's Debugger. If you have a specific question, you may want to consider posting it on the development mailing list. If you find more useful resources, please file a bugreport with that info.
| Debugger Reference Manual | This is the most in-depth source on how to work with the Debugger. | |
| Blogposts | There are a few articles on the Debugger, mostly by Rene Gollent after implementing a new feature. | |
| BeGeistert 026 video | A video from the BeGeistert meeting in 2012, in which Ingo Weinhold demonstrates the state of the Debugger back then and shows other interesting tools like the profiler to hunt down bottlenecks. |